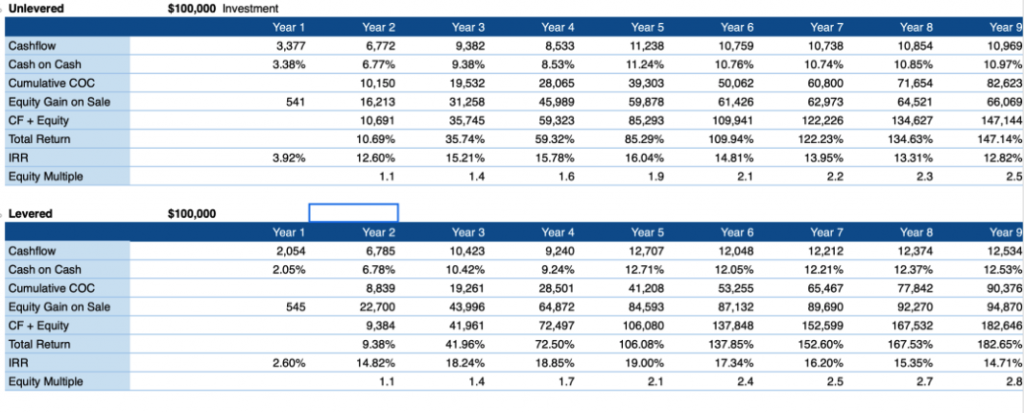
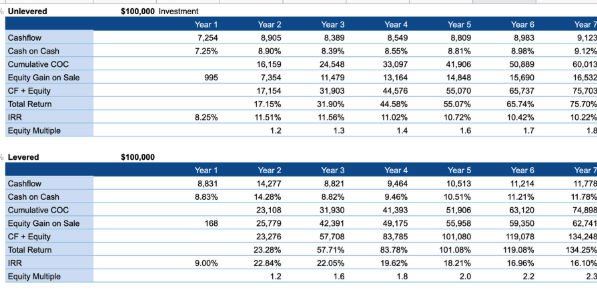
Stabilized Income vs Value-Add? As we select assets to put into our fund we want to be aligned with the goals and risk tolerance of our investors. Stabilized Income Year 1-2-3 Cashflow: 8.8% – 14.3% – 8.8%Year 7 “Top Speed” Cashflow: 11.8%Year 7 Total Return: 134%Lower Risk/Reward profile than “Stabilized Income” Quicker cashflow Value-Add Year 1-2-3 Cashflow: 2.0% – 6.8% – 10.4%Year 7 “Top Speed” Cashflow: 12.2%Year 7 Total Return: 152.6%Higher Risk/Reward profile than “Stabilized Income” ModelHigher total returns after first few years Value-Add *Proforma above is of one value-add park. Fund will consist of multiple parks. Stabilized Income *Proforma above is of one stabilized park. Fund will consist of multiple parks. Conclusion In the end, as an investor you need to ask yourself how does this fit within your larger personal portfolio?What type of risk/reward profile would be ideal for your mobile home park assets?